If you’re using Climate TRACE data for an emissions reduction project, policy, or research paper, we’d love to know more! We occasionally feature highly impactful projects on our website and in our newsletter. Please contact us.
Examples and Case Studies
Example Use Cases
What are other governments, companies, and institutions using Climate TRACE data for? A lot! We are currently tracking 31 known use cases and learning more all the time. Below are three examples of the most common, high-impact use cases happening right now.
Supply Chain Decarbonization
Applicable Subsectors
Cement
Iron and steel
Aluminum
Petrochemical steam cracking
Rice cultivation
Synthetic fertilizer application
Domestic shipping
International shipping
Companies that buy large amounts of raw materials from highly-emitting sectors have begun using Climate TRACE data to verify self-reported emissions from suppliers and to identify cases in which lower-emitting options are available.
Example user

Data-Driven Policymaking At All Levels
Applicable Subsectors
All
Policymakers in all levels of government, but particularly sub-national governments, often lack detailed, up-to-date emissions data from their own territory. Several have begun using Climate TRACE data to develop ambitious, data-driven decarbonization plans that start with a clear understanding of the largest sources and sinks of emissions in their own area.
Example user
Bringing Transparency To Financed Emissions
Applicable Subsectors
All
Financial organizations such as development banks and investors are using Climate TRACE data to help count greenhouse gas emissions embedded in their portfolios, verify self-reported data from emissions source owners, and prioritize lower-emitting investments.
Example user
Case Study: The States and Regions Remote Sensing Project (STARRS)
The States and Regions Remote Sensing Project (STARRS) illustrates the value of collaboration in generating independent greenhouse gas emissions data.

Did You Know?
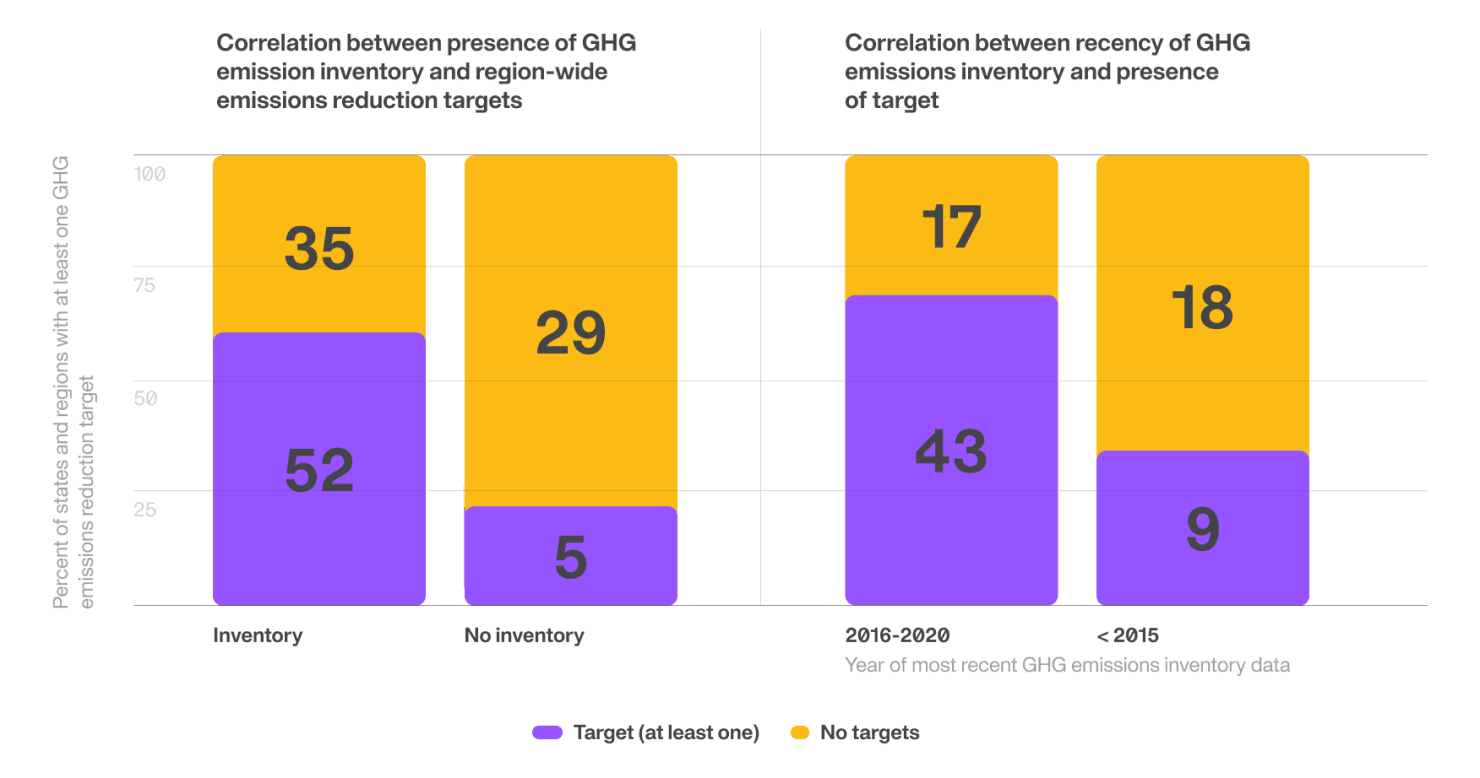
Research by Climate Group, as Secretariat to the Under2 Coalition, shows that states and regions with a recent inventory of emissions data are more likely to set emissions reduction targets.
What’s more, having access to a detailed breakdown of region-wide greenhouse gas emissions allows states and regions to identify their highest-emitting sectors and design and implement targeted mitigation strategies.
Our Approach
STARRS brings together Climate TRACE, Climate Group, and six states around the world to develop detailed, up-to-date, regional emissions data.
All of the states participating in this project previously had access to varying levels of emissions data, but many reported that it was difficult to source and generate their own inventories. As a result, their data were incomplete and often only updated every few years.
Climate TRACE is able to fill in these gaps and generate independent emissions estimates that don’t primarily rely on self-reported data. Climate TRACE pairs satellite and remote sensing data with artificial intelligence to identify emitting activities and calculate greenhouse gas emissions.
Through the STARRS collaboration, six regional governments shared data and provided feedback to improve the accuracy and relevance of Climate TRACE data.
About the Data
Climate TRACE’s technologically-advanced approach offers an independent look at emissions, providing states and regions with both complementary and new information to support their monitoring efforts.
Climate TRACE also aims to provide emissions data updates on an annual basis going forward.
To help our partners act decisively, we go beyond emissions estimates by sector or industry and break down aggregated data to detect emissions from individual sources such as power plants and oil fields. With this information, regional governments can take data-informed actions such as incentivizing efficiency improvements by major emitters, or introducing measures to help farmers switch to regenerative farming practices.
Review our methodology to learn more about how Climate TRACE estimates emissions and how it's different from the states' methodologies.
Latest Projects
Abruzzo Italy
01
Basque Country Spain
02
Jalisco Mexico
03
Pernambuco Brazil
04
Querétaro Mexico
05
Western Cape South Africa
06
Work with us
Use timely and granular emissions data and insights to inform your work to create emissions reduction plans and policies.
While our ultimate goal is to create emissions inventories for every state around the world, we prioritize projects based on opportunities for direct collaboration. If you’re interested in partnering, please contact us.
Climate Group through its role as Secretariat of the Under2 Coalition, brings together states, regions, provinces and other subnational governments committed to achieving net zero emissions by 2050 at the latest. Find out why states and regions are so important for climate action: https://www.theclimategroup.org/under2-coalition.