Climate TRACE Releases February 2025 Emissions Data
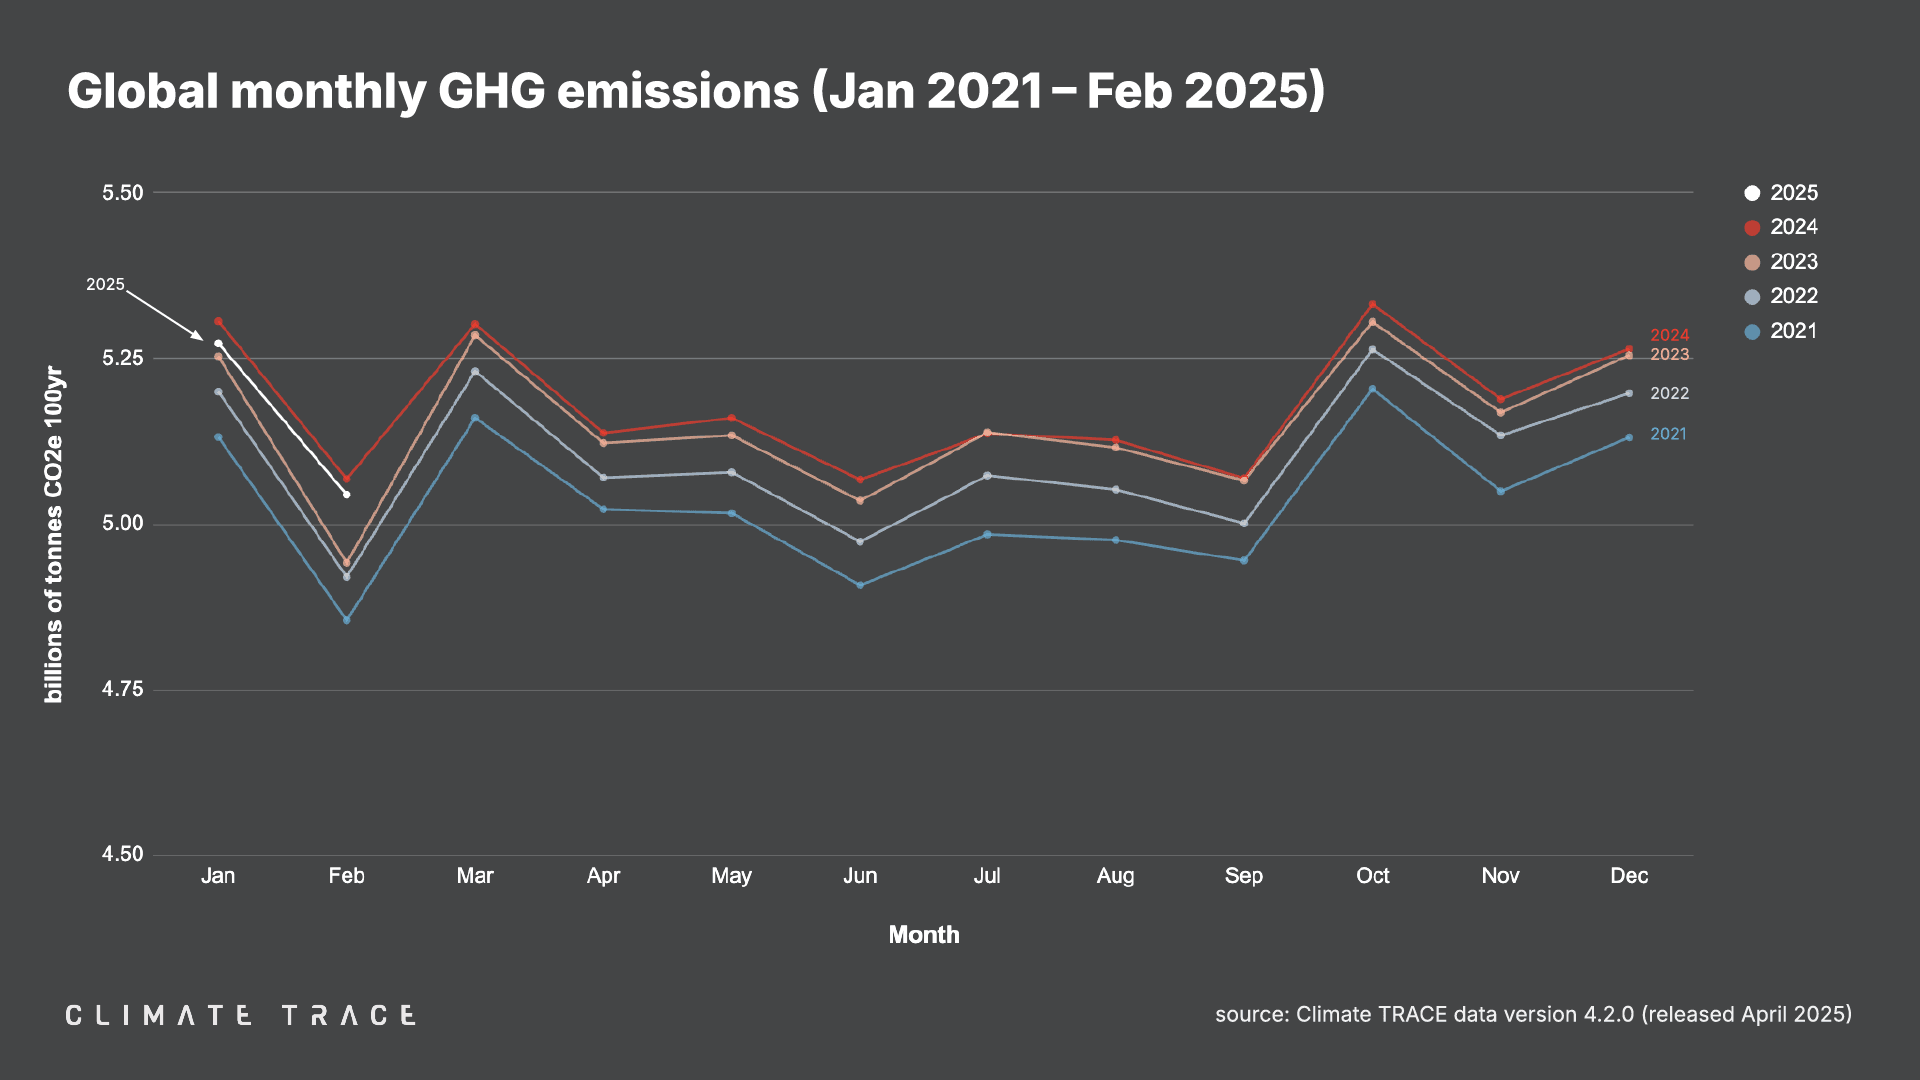
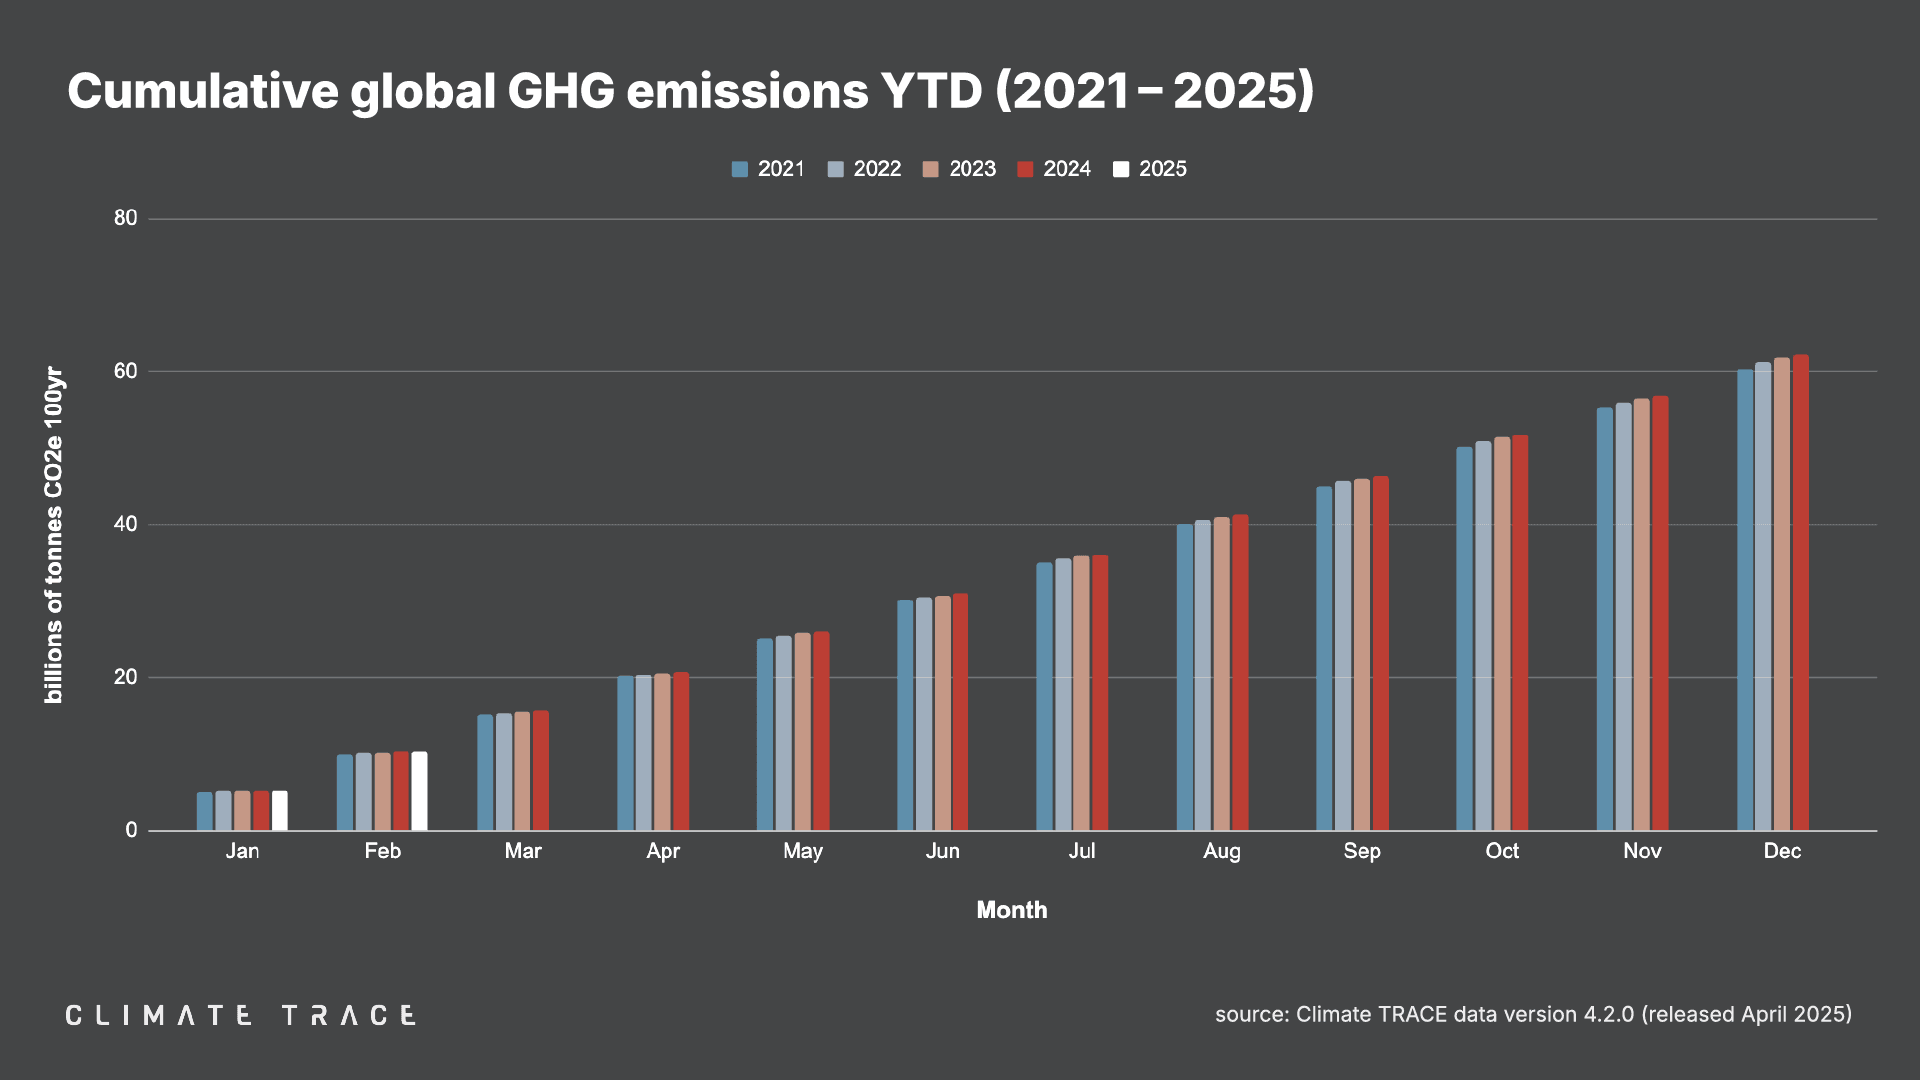
April 24, 2025 – Today, Climate TRACE reported that global greenhouse gas emissions for the month of February 2025 totaled 5.04 billion tonnes CO2e. This represents a decrease of 0.47% vs. February 2024. It should be noted that, as a leap year, February 2024 was one day longer than February 2025, and therefore had one additional day’s worth of emissions. Total global year-to-date emissions total 10.32 billion tonnes CO2e. This is 0.55% lower than the previous year-to-date total for the first two months of 2024. Global methane emissions in February were 31.70 million tonnes — a 0.01% decrease compared to February 2024.
Greenhouse Gas Emissions by Country: February 2025
Climate TRACE’s preliminary estimate of February 2025 emissions in China, the world’s top emitting country, is 1.47 billion tonnes CO2e, which increased by 3.04 million tonnes of CO2e or 0.21% as compared to February 2024.
Of February 2025’s other top five emitting countries:
– United States emissions declined by 6.88 million tonnes CO2e, or 1.18% year over year;
– Russia emissions declined by 2.06 million tonnes CO2e, or 0.63% year over year;
– India emissions declined by 1.97 million tonnes CO2e, or 0.63% year over year;
– Indonesia emissions declined by 0.87 million tonnes CO2e, or 0.72% year over year.
In the EU, which as a bloc would be the third largest source of emissions in February 2025, emissions declined by 2.63 million tonnes CO2e compared to February 2024, or 0.79%.
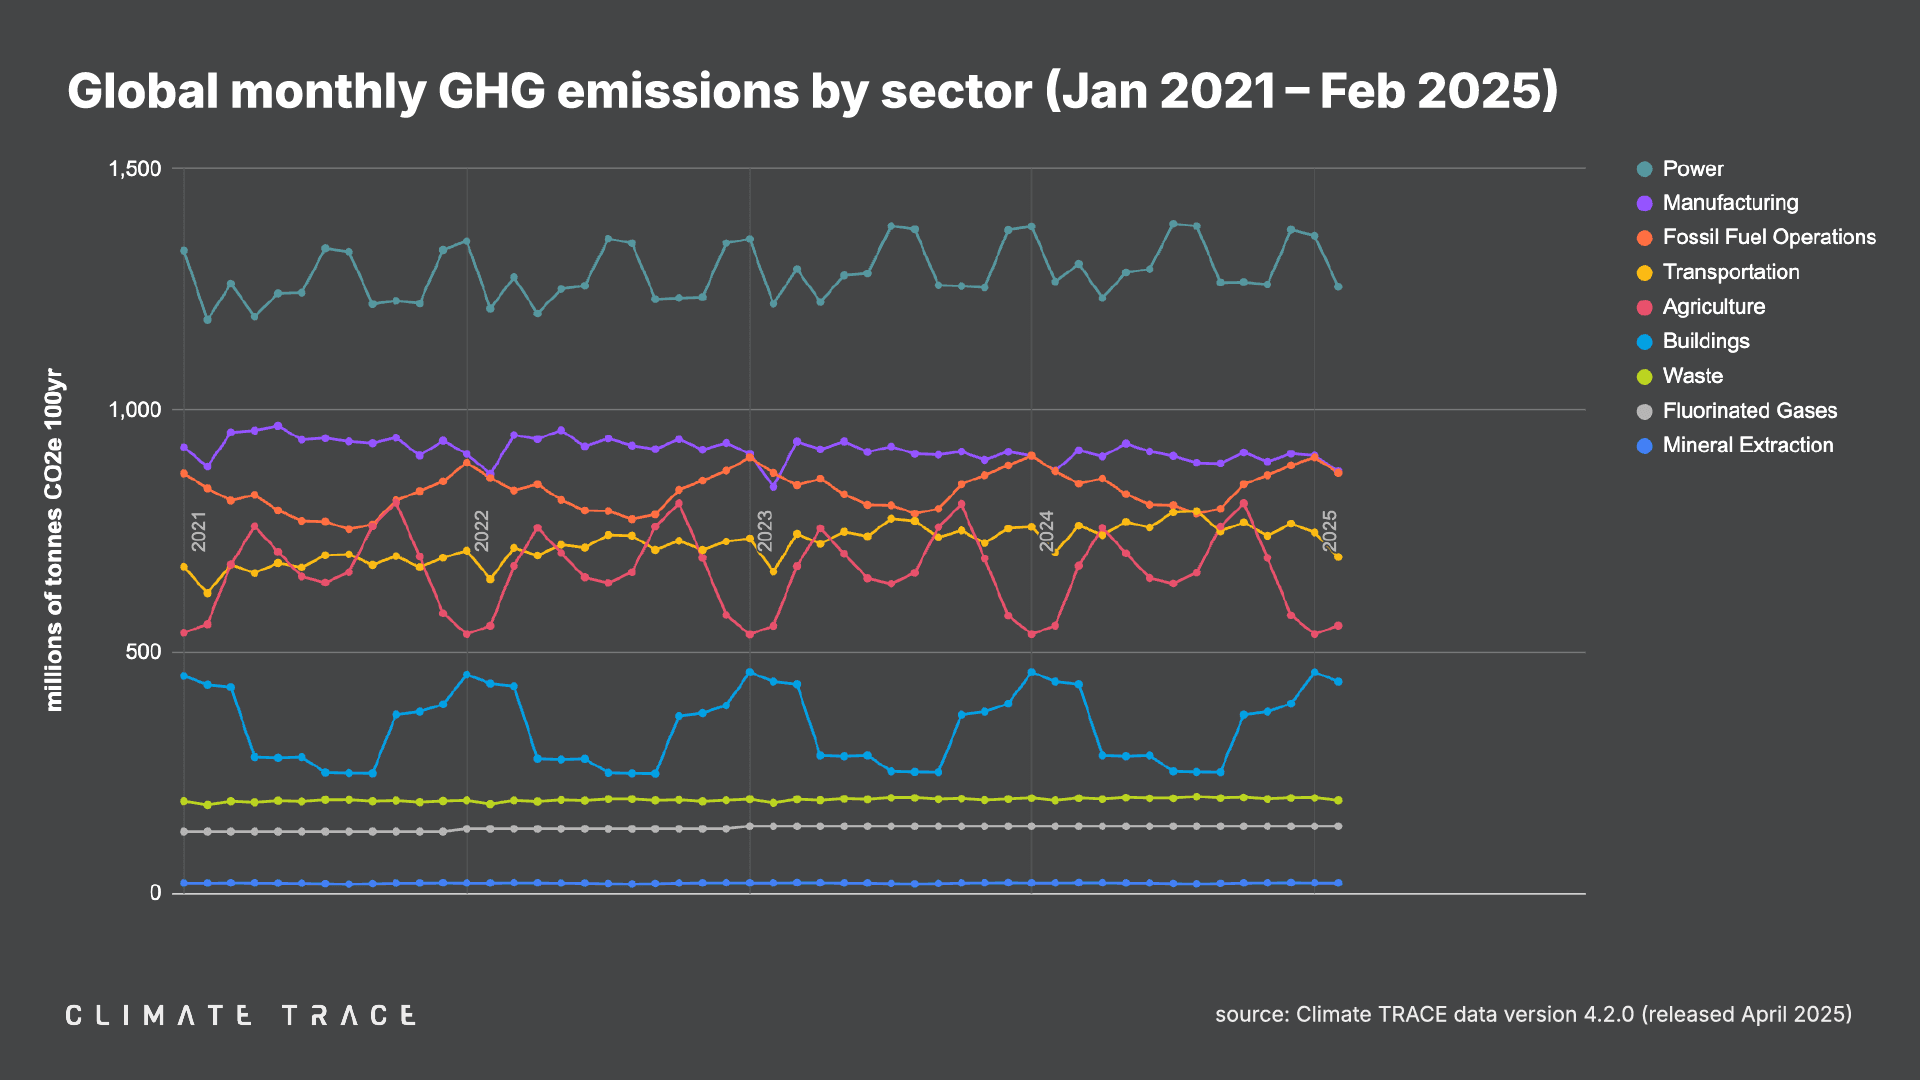
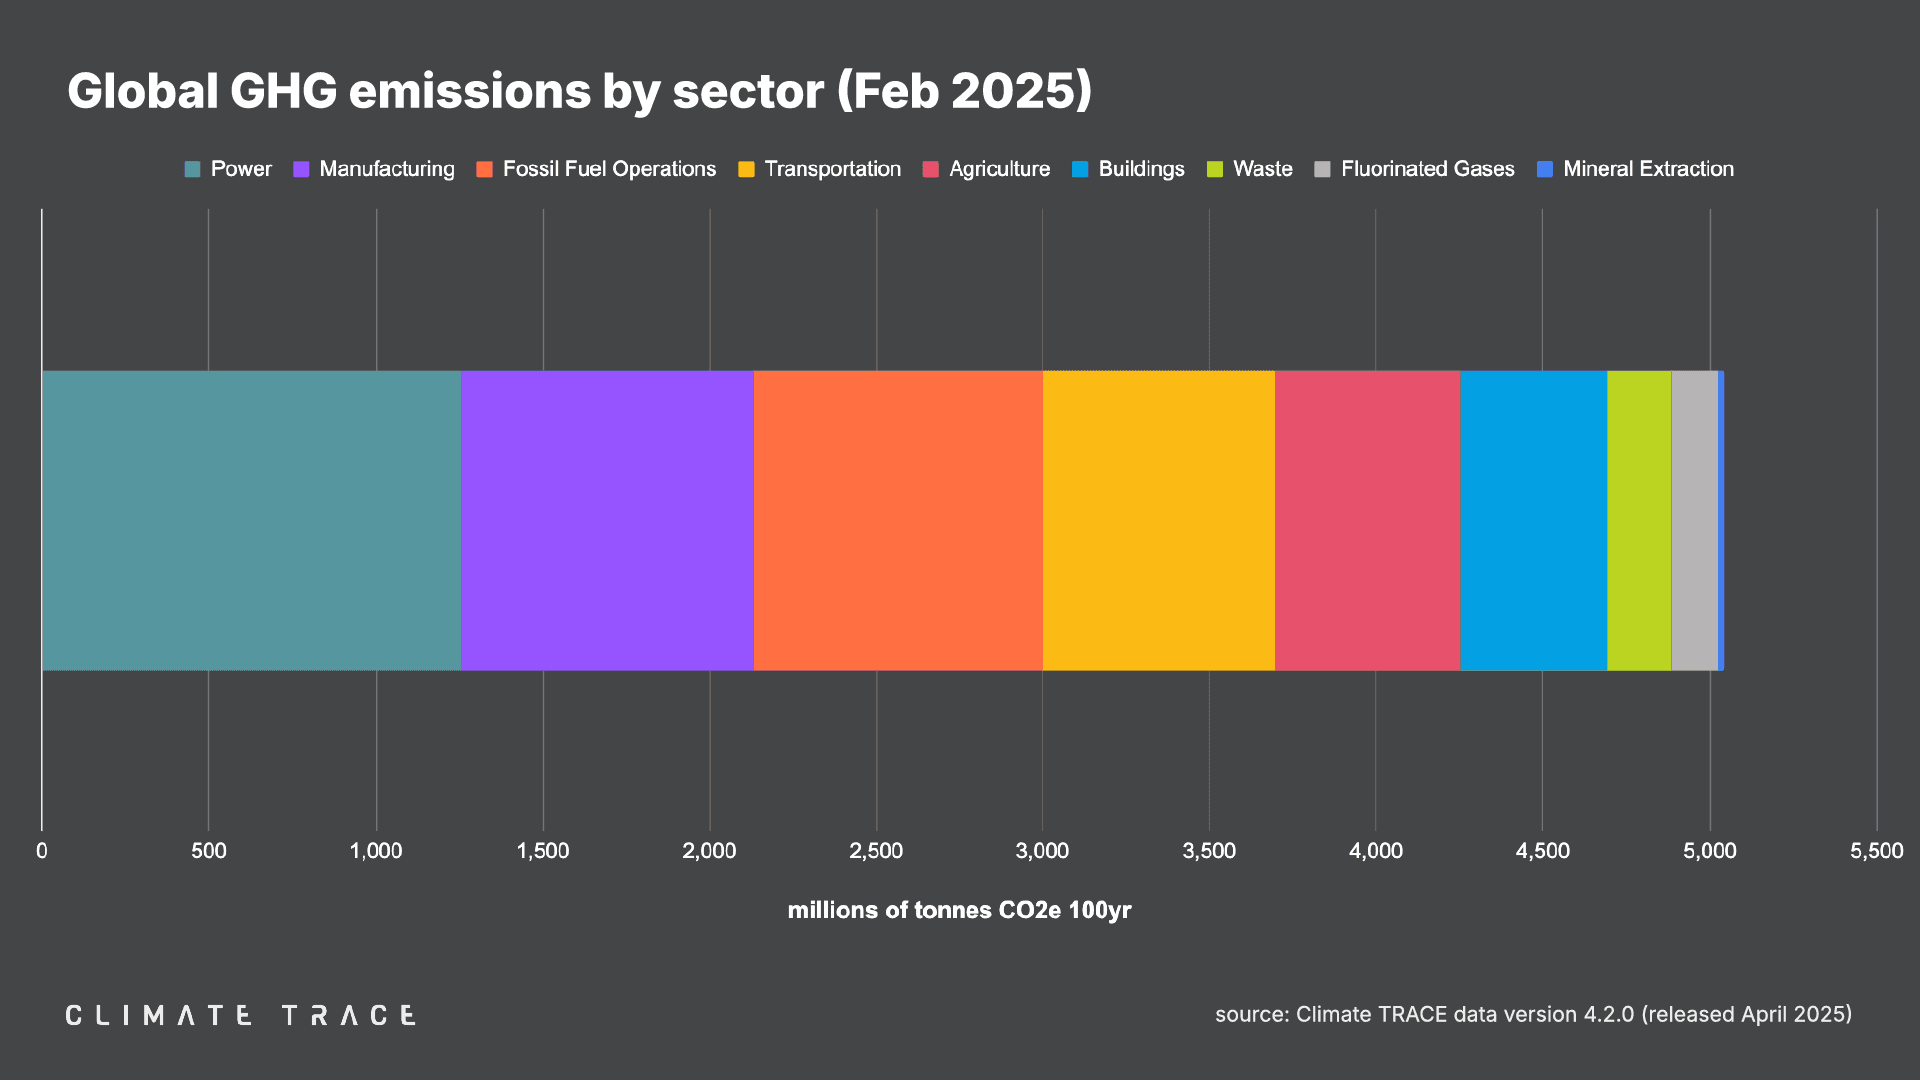
Greenhouse gas emissions increased year over year in buildings and decreased in fossil fuel operations, manufacturing, power, and transportation. Transportation saw the greatest change in emissions year over year, with emissions declining by 1.29%.
– Agriculture emissions were 554.62 million tonnes CO2e, unchanged vs. February 2024;
– Buildings emissions were 438.59 million tonnes CO2e, unchanged vs. February 2024;
– Fossil fuel operations emissions were 870.79 million tonnes CO2e, a 0.39% decrease vs. February 2024;
– Manufacturing emissions were 873.74 million tonnes CO2e, a 0.13% decrease vs. February 2024;
– Mineral extraction emissions were 21.89 million tonnes CO2e, unchanged vs. February 2024;
– Power emissions were 1,256.30 million tonnes CO2e, a 0.79% decrease vs. February 2024;
– Transportation emissions were 696.78 million tonnes CO2e, a 1.29% decrease vs. February 2024;
– Waste emissions were 192.56 million tonnes CO2e, unchanged vs. February 2024.
Greenhouse Gas Emissions by City: February 2025
The urban areas with the highest total greenhouse gas emissions in February 2025 were Shanghai, China; Tokyo, Japan; Beijing, China; Suzhou, China; and Houston, United States.
The urban areas with the greatest increase in absolute emissions year over year were Yu, China; Gangneung-si, South Korea; Rizhao, China; Kamisu, Japan; and Shancheng, China. Those with the largest absolute emissions decline were Los Angeles, United States; New York, United States; Tokyo, Japan; Houston, United States; and Dallas, United States.
The urban areas with the greatest increase in emissions as a percentage of their total emissions were Trincomalee, Sri Lanka; Heilbronn, Germany; Yu, China; Slavyansk-na-Kubani, Russia; and Gangneung-si, South Korea. Those with the greatest decrease by percentage were Arauca, Colombia; Yacuiba, Bolivia; Raja, South Sudan; Nicosia, Turkish Republic of Northern Cyprus; and Murnei, Sudan.
For all updates to Climate TRACE country-, state-, city-, sector-, and asset-level data, visit climatetrace.org.
RELEASE NOTES
Revisions to existing Climate TRACE data are common and expected. They allow us to take the most up-to-date and accurate information into account. As new information becomes available, Climate TRACE will update its emissions totals (potentially including historical estimates) to reflect new data inputs, methodologies, and revisions.
With the addition of February 2025 data, the Climate TRACE database is now updated to version v4.2.0. With this version, the database was updated to standardize the use of lowercase ‘t’ for tonnes rather than uppercase ‘T’. Individual sector teams also added 13,757 additional cattle operation emissions sources in France; added 19 oil and gas refining assets and added additional data covering April through June 2024 for refineries in Asia, the Middle East, Africa, Latin America, and parts of Europe; fixed a bug affecting aluminum manufacturing; and added April–June 2024 data for petrochemical steam cracking facilities in Asia and the Middle East. A detailed description of all sectors’ data updates is available in our changelog here.
To learn more about what is included in our monthly data releases and for frequently asked questions, click here. All methodologies for Climate TRACE data estimates are available to view and download here. For any further technical questions about data updates, please contact: coalition@ClimateTRACE.org.
To sign up for monthly updates from Climate TRACE, click here.
Emissions data for March 2025 is scheduled for release on May 29, 2025.
About Climate TRACE
The Climate TRACE coalition was formed by a group of AI specialists, data scientists, researchers, and nongovernmental organizations. Current members include Carbon Yield; CTrees; Duke University’s Nicholas Institute for Energy, Environment & Sustainability; Earth Genome; Former Vice President Al Gore; Global Energy Monitor; Hypervine.io; Johns Hopkins University Applied Physics Lab; OceanMind; RMI; TransitionZero; and WattTime. Climate TRACE is also supported by more than 100 other contributing organizations and researchers, including key data and analysis contributors: Arboretica, Carnegie Mellon University’s CREATE Lab, Global Fishing Watch/emLab, Michigan State University, Open Supply Hub, and University of Malaysia Terengganu. For more information about the coalition and a list of contributors, click here.
Media Contacts
Fae Jencks and Nikki Arnone for Climate TRACE