Climate TRACE Releases May 2026 Emissions Data
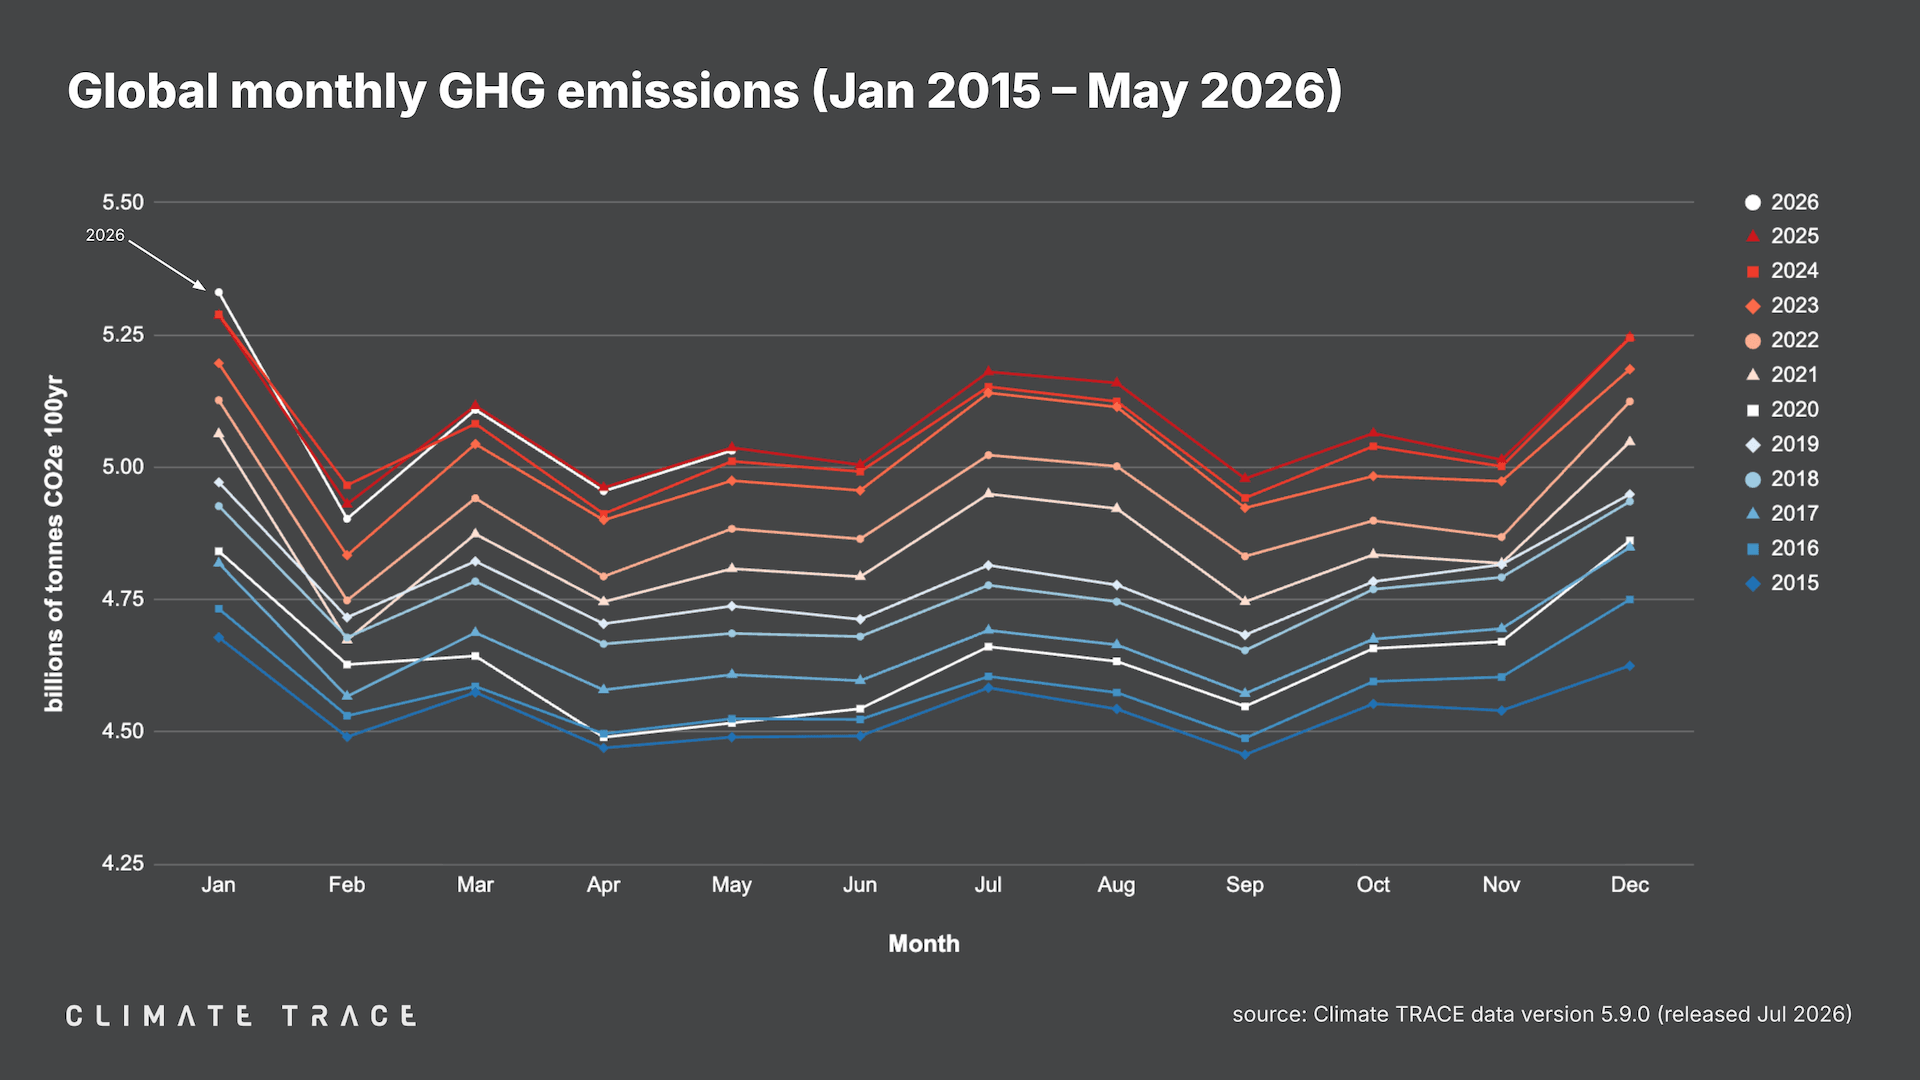
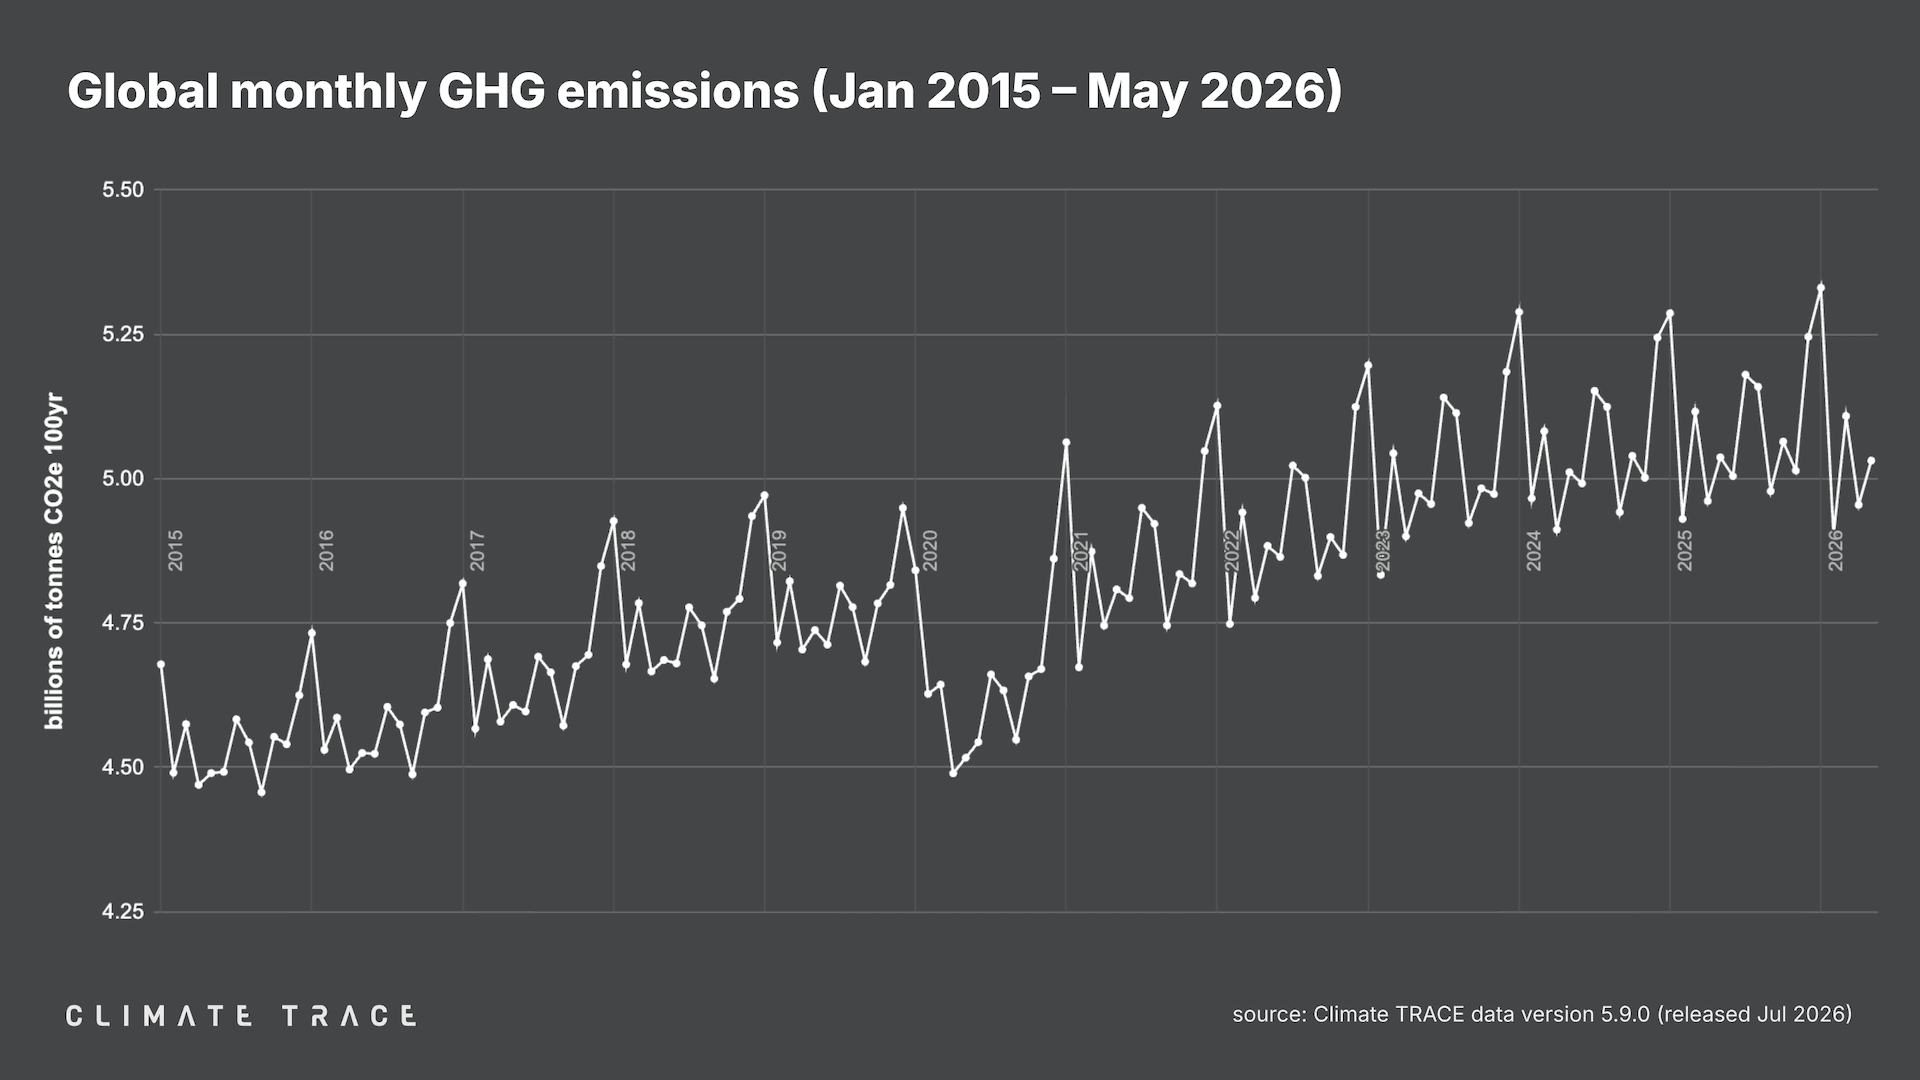
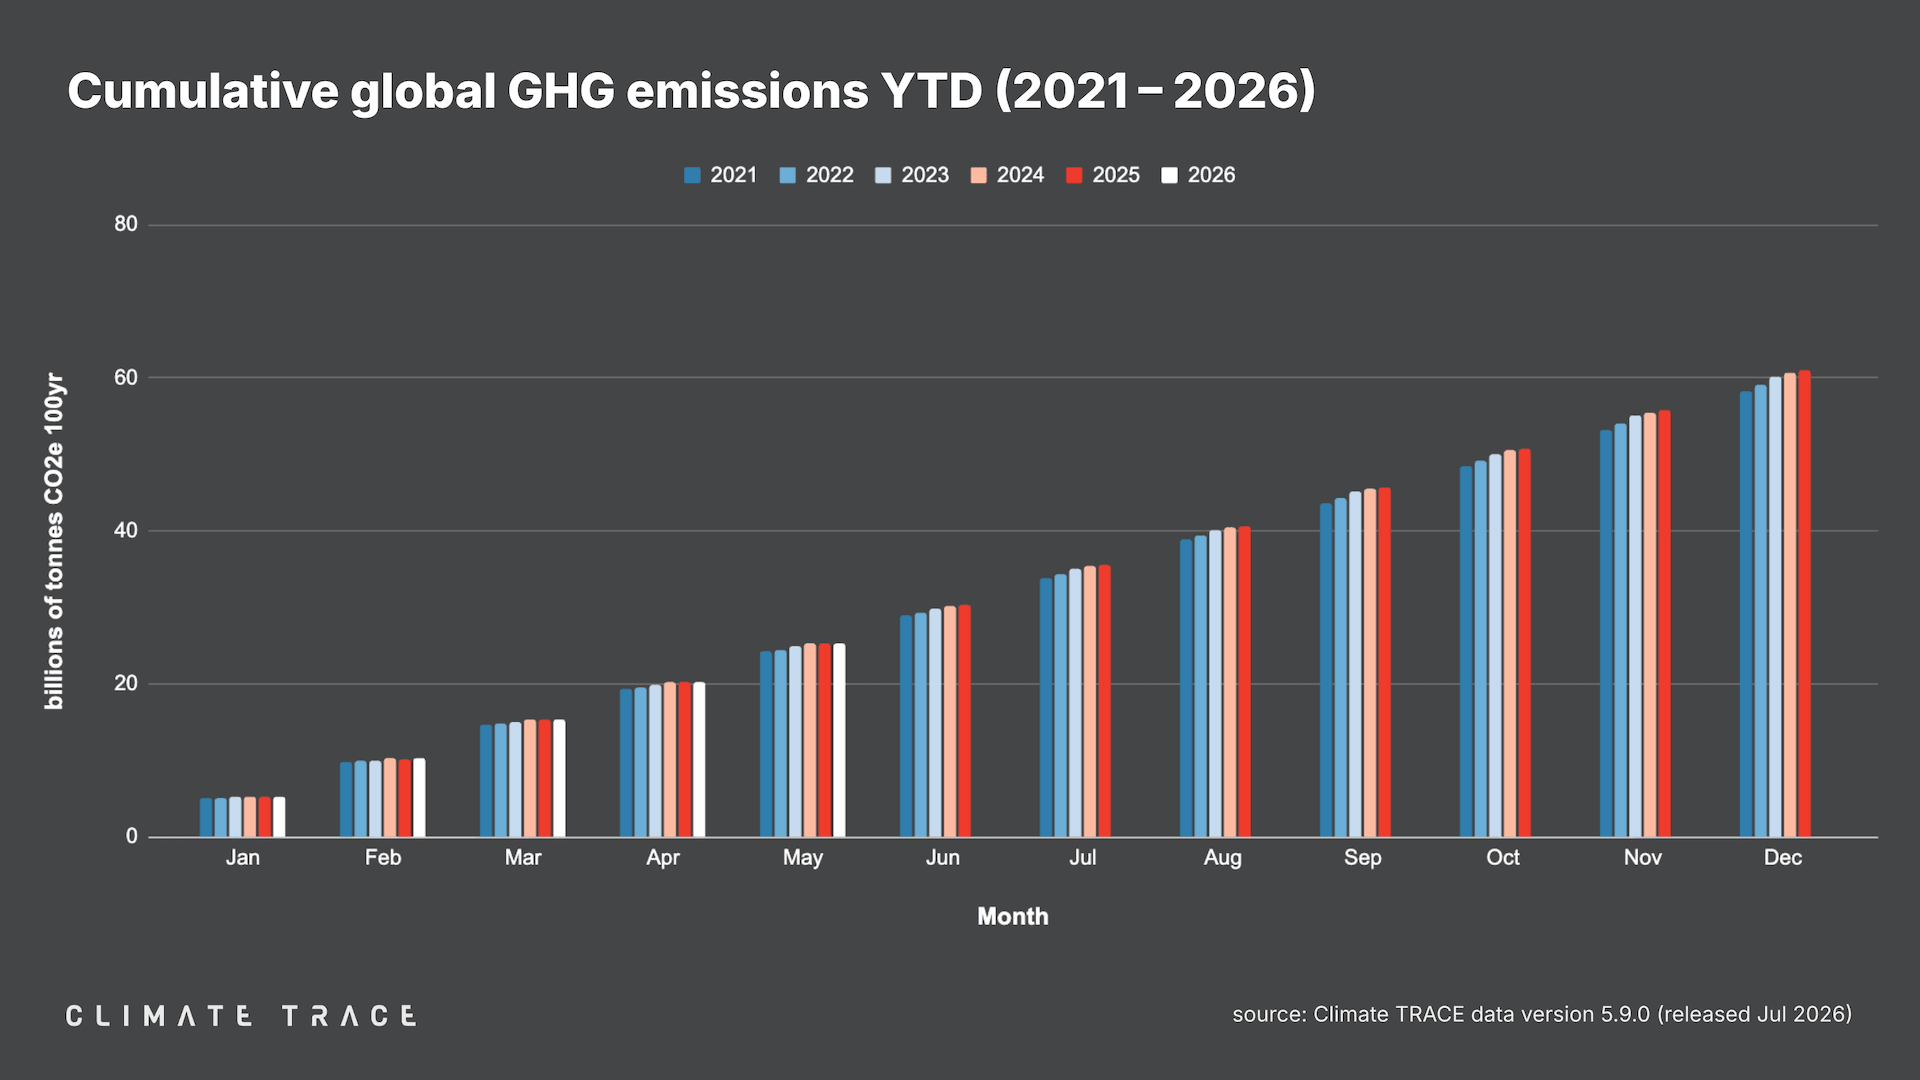
July 30, 2026 -- Today, Climate TRACE reported that global greenhouse gas (GHG) emissions for the month of May 2026 totaled 5.0 billion tonnes CO₂e. This represents a decrease of 0.1% vs. May 2025. Total global year-to-date emissions are 25.3 billion tonnes CO₂e. This is unchanged compared to 2025's year-to-date total for the same time period. Global methane emissions in May 2026 were 34.2 million tonnes CH₄, an increase of 0.1% vs. May 2025.
Data tables summarizing GHG and primary particulate matter (PM2.5) emissions totals by sector, country, and the top 100 urban areas for May 2026 are available for download here.
Greenhouse Gas Emissions by Country: May 2026
Climate TRACE's preliminary estimate of May 2026 emissions in China, the world's top emitting country, is 1.4 billion tonnes CO₂e, a decline of 8.5 million tonnes of CO₂e, or 0.6% vs. May 2025.
Of the other top five emitting countries:
-
United States emissions increased by 2.8 million tonnes CO₂e, or 0.5% year over year;
-
India emissions increased by 3.0 million tonnes CO₂e, or 0.8% year over year;
-
Russia emissions declined by 1.5 million tonnes CO₂e, or 0.6% year over year;
-
Indonesia emissions declined by 0.8 million tonnes CO₂e, or 0.6% year over year.
In the EU, which as a bloc would be the fourth largest source of emissions in May 2026, emissions increased by 4.4 million tonnes CO₂e compared to May 2025, or 1.5%.
Data on all other countries and territories are available in our Country/Territory Inventory.
Greenhouse Gas Emissions by Sector: May 2026
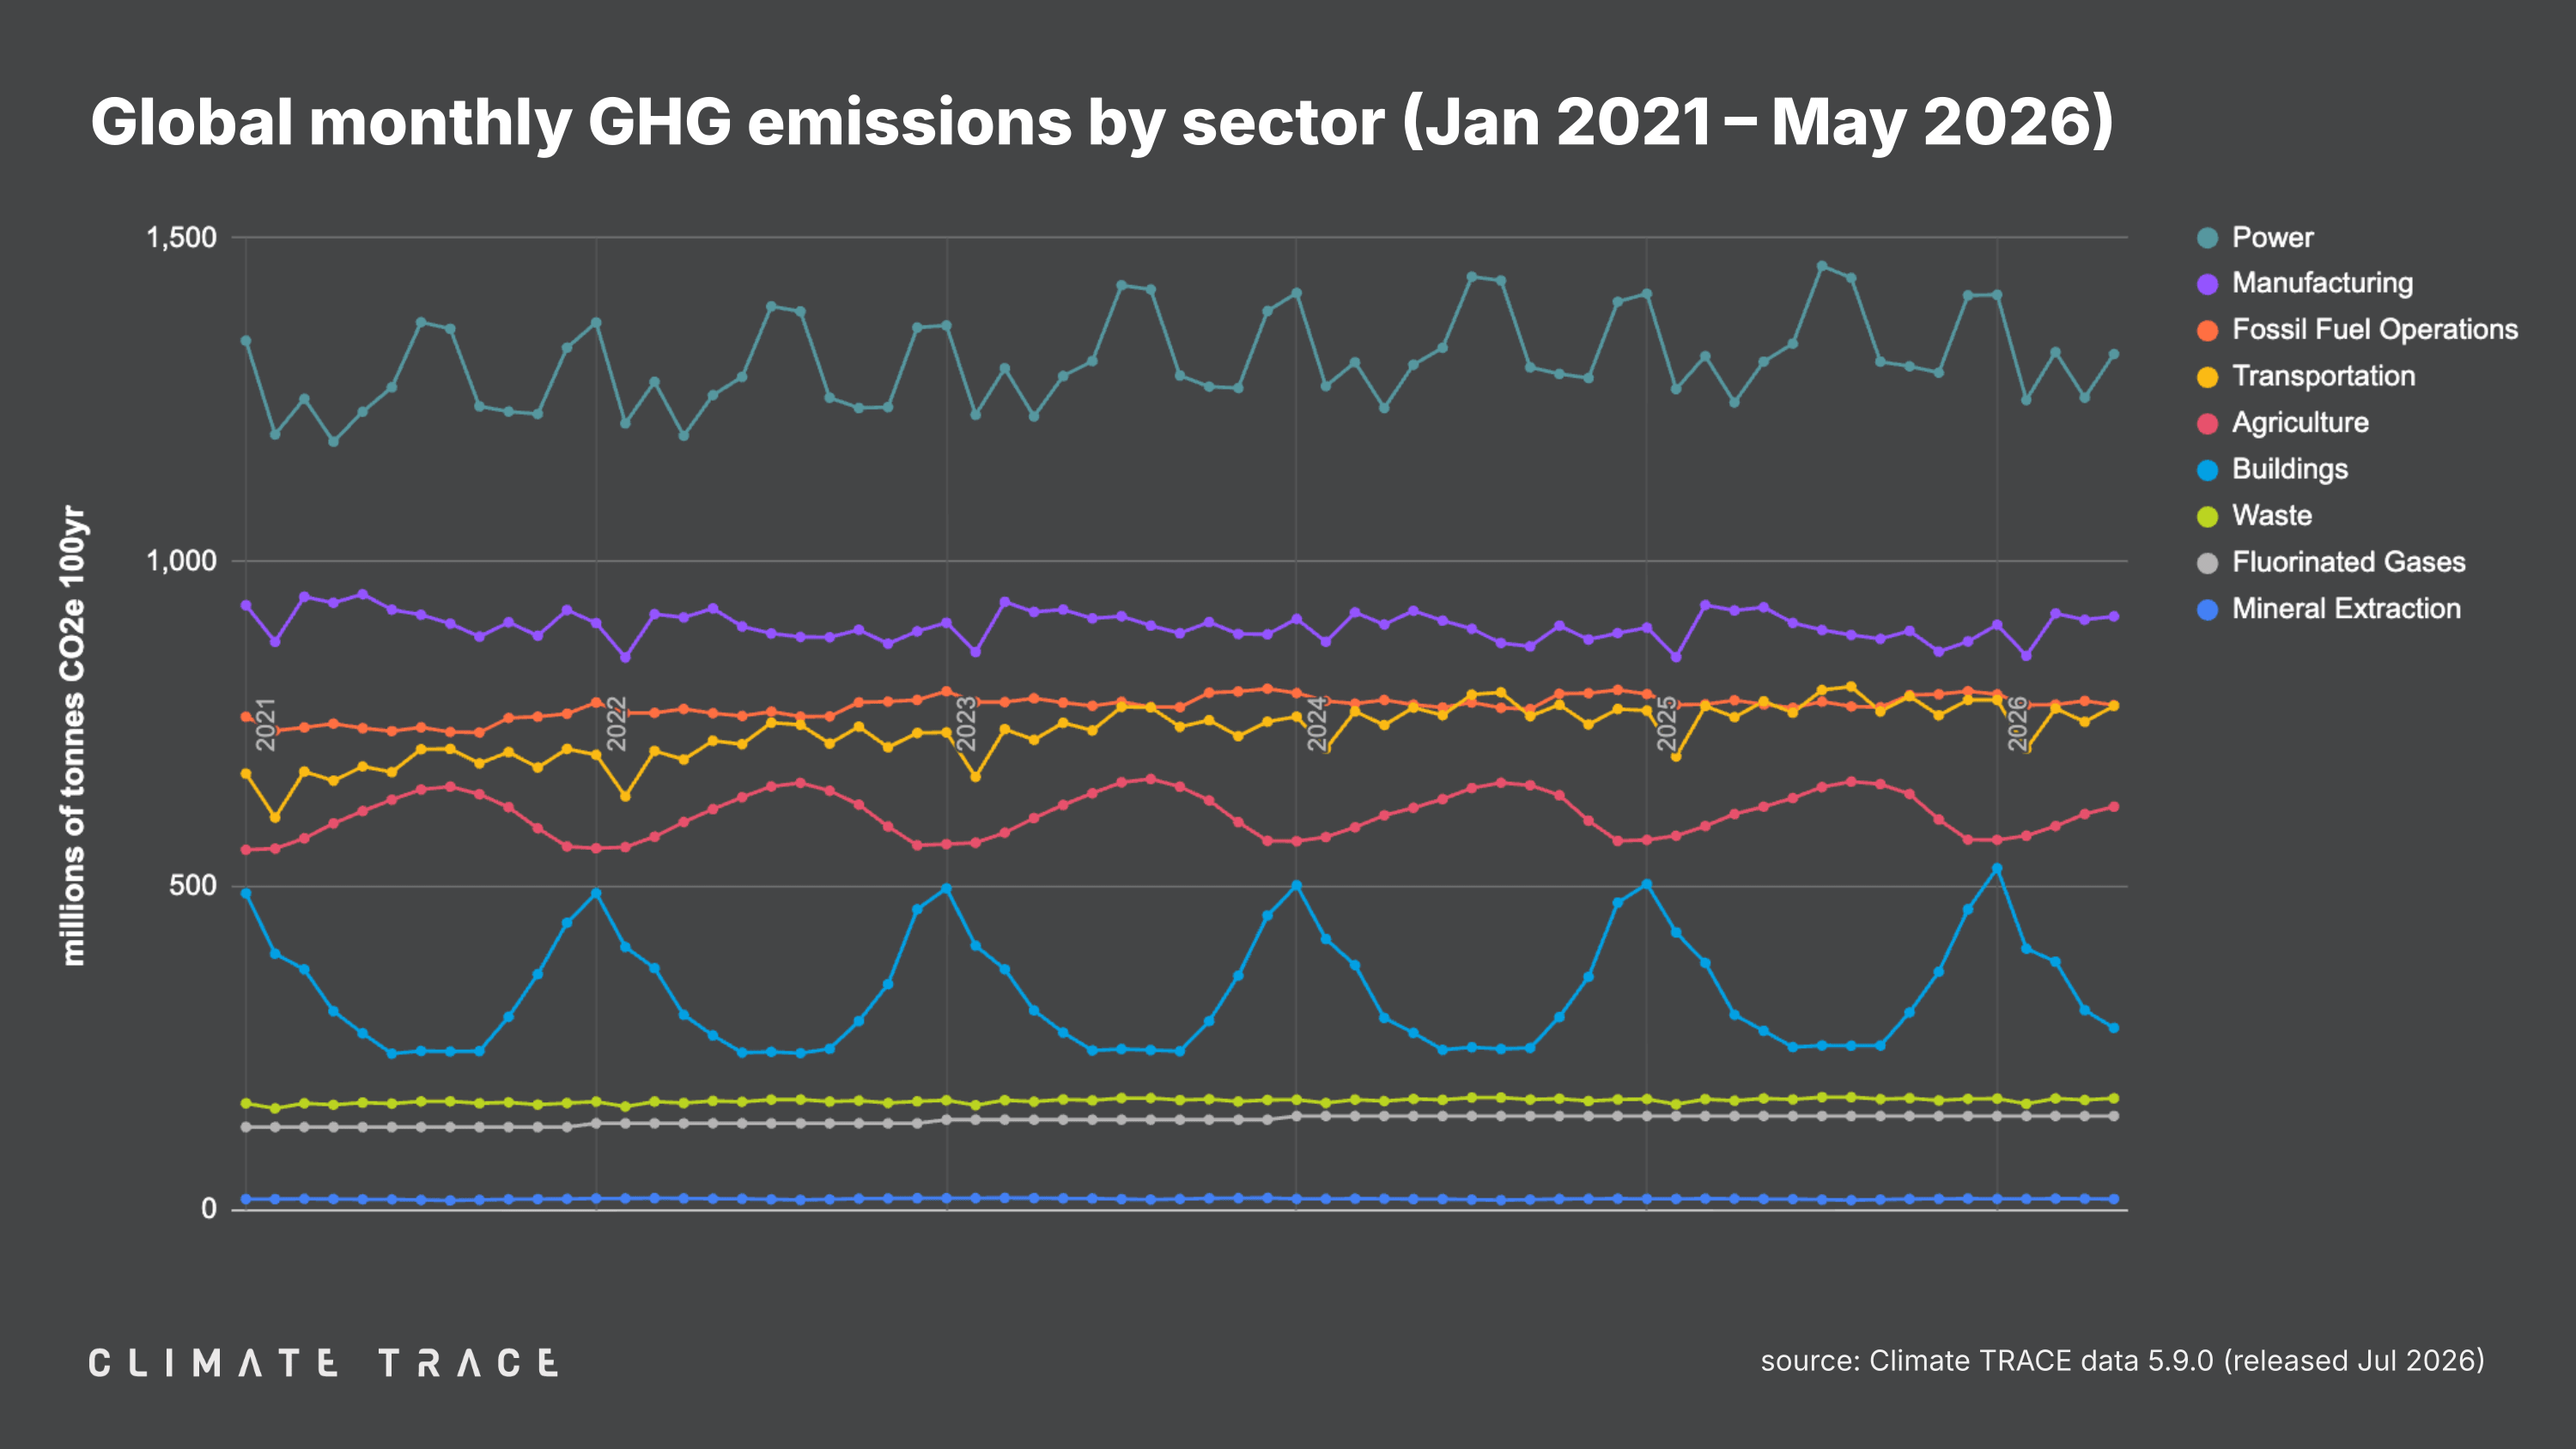
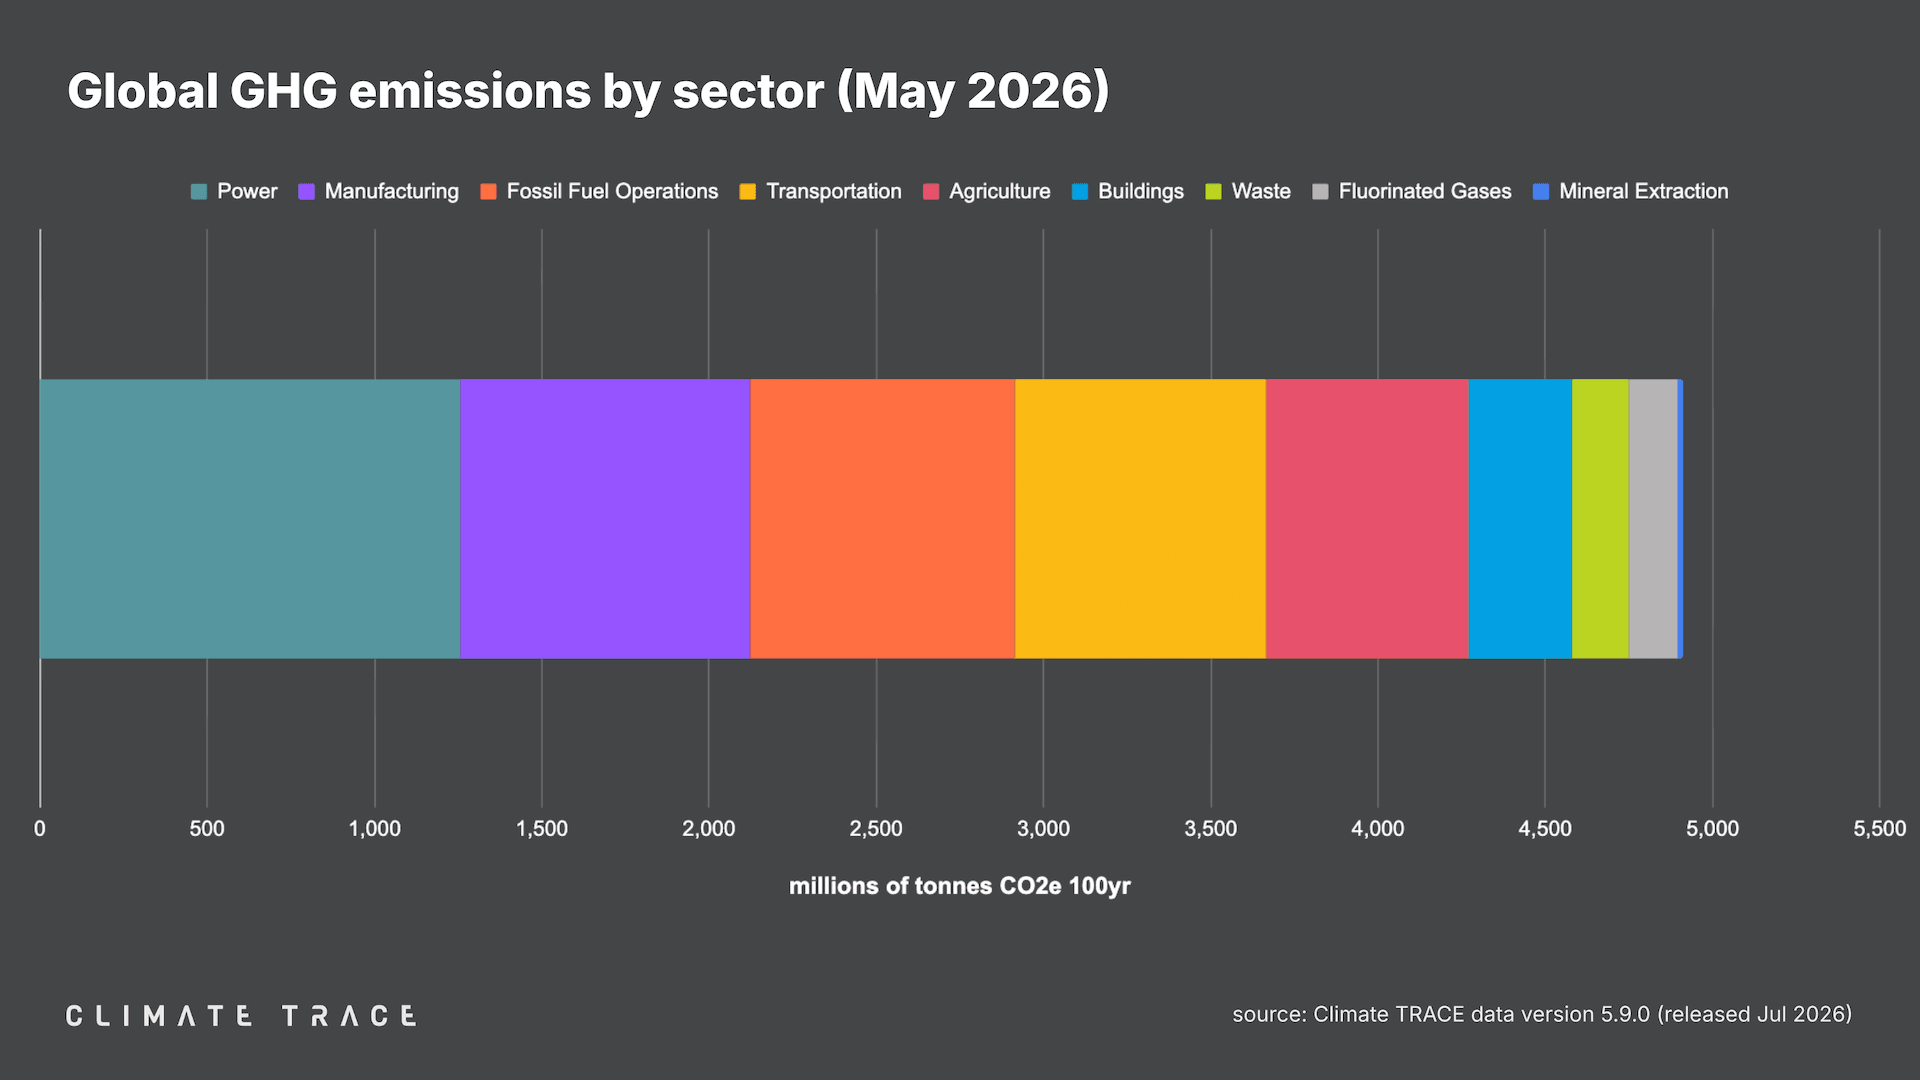
Greenhouse gas emissions increased in May 2026 vs. May 2025 in buildings, power, and waste, and decreased in fossil fuel operations, manufacturing, and transportation. Buildings saw the greatest change in emissions year over year, with emissions increasing by 1.6% as compared to May 2025.
-
Agriculture emissions were 622.3 million tonnes CO₂e, unchanged vs. May 2025;
-
Buildings emissions were 280.9 million tonnes CO₂e, a 1.6% increase vs. May 2025;
-
Fluorinated gases emissions were 145.0 million tonnes CO₂e, unchanged vs. May 2025;
-
Fossil fuel operations emissions were 779.2 million tonnes CO₂e, a 0.1% decrease vs. May 2025;
-
Manufacturing emissions were 916.0 million tonnes CO₂e, a 1.5% decrease vs. May 2025;
-
Mineral extraction emissions were 16.9 million tonnes CO₂e, unchanged vs. May 2025;
-
Power emissions were 1,320.8 million tonnes CO₂e, a 0.9% increase vs. May 2025;
-
Transportation emissions were 777.7 million tonnes CO₂e, a 0.9% decrease vs. May 2025;
-
Waste emissions were 172.4 million tonnes CO₂e, a 0.2% increase vs. May 2025.
Greenhouse Gas Emissions by City: May 2026
The urban areas with the highest total GHG emissions in May 2026 were Shanghai, China; Tokyo, Japan; Houston, United States; Los Angeles, United States; and New York, United States.
The urban areas with the greatest increases in absolute emissions in May 2026 as compared to May 2025 were Mannheim, Germany; Korba, India; Chicago, United States; Anshan, China; and Cologne, Germany. Those with the largest absolute emissions declines between this May and last May were Zhangjiagang, China; Dubai, United Arab Emirates; Manama, Bahrain; Detroit, United States; and Seoul, South Korea.
The urban areas with the greatest increases in emissions as a percentage of their total emissions were Rongshui, China; Uruguaiana, Brazil; Barletta, Italy; Sukkur, Pakistan; and Campo Largo, Brazil. Those with the greatest decreases by percentage were Lufeng, China; Yenakiieve, Ukraine; Macherla, India; Ergani, Türkiye; and Sault Ste. Marie, Canada.
RELEASE NOTES Revisions to existing Climate TRACE data are common and expected. They allow us to take the most up-to-date and accurate information into account. As new information becomes available, Climate TRACE will update its emissions totals (which could include historical estimates) to reflect new data inputs, methodologies, and revisions.
With the addition of May 2026 data, the Climate TRACE database is now updated to version V5.9.0. In this release, asset coverage was updated across several sectors, including coal mining (516 new assets added and 61 removed due to closures), domestic aviation (7 new sources), and international aviation (4 new sources). Model updates include the integration of a new agriculture data source (Spatial Production Allocation Model, SPAM 2020) and the addition of new steel production capacity types in the iron and steel sector (induction furnaces and direct reduced iron with induction furnaces). Additional metadata was added across multiple sectors to provide increased granularity of source types, including oil and gas refining (fuel combustion, fugitive and process, and flaring emissions) and aluminum (smelting process vs. fuel emissions).
A detailed description of data updates is available in our changelog here.
To learn more about what is included in our monthly data releases and for frequently asked questions, click here.
All methodologies for Climate TRACE data estimates are available to view and download here.
For any further technical questions about data updates, please contact: coalition@ClimateTRACE.org.
To sign up for monthly updates from Climate TRACE, click here.
Emissions data for June 2026 are scheduled for release on August 27, 2026.
About Climate TRACE The Climate TRACE coalition was formed by a group of AI specialists, data scientists, researchers, and nongovernmental organizations. Current members include Carbon Yield; Carnegie Mellon University's CREATE Lab; CTrees; Duke University's Nicholas Institute for Energy, Environment & Sustainability; Earth Genome; Former Vice President Al Gore; Global Energy Monitor; Global Fishing Watch/emLab; Johns Hopkins University Applied Physics Lab; OceanMind; RMI; TransitionZero; and WattTime. Climate TRACE is also supported by more than 100 other contributing organizations and researchers, including key data and analysis contributors: Arboretica, Michigan State University, Ode Partners, Open Supply Hub, Saint Louis University's Remote Sensing Lab, and University of Malaysia Terengganu. For more information about the coalition and a list of contributors, click here.
Media Contacts Fae Jencks and Nikki Arnone for Climate TRACE media@climatetrace.org