Saint Louis University’s Vasit Sagan and Derek Tesser on mapping cattle emissions
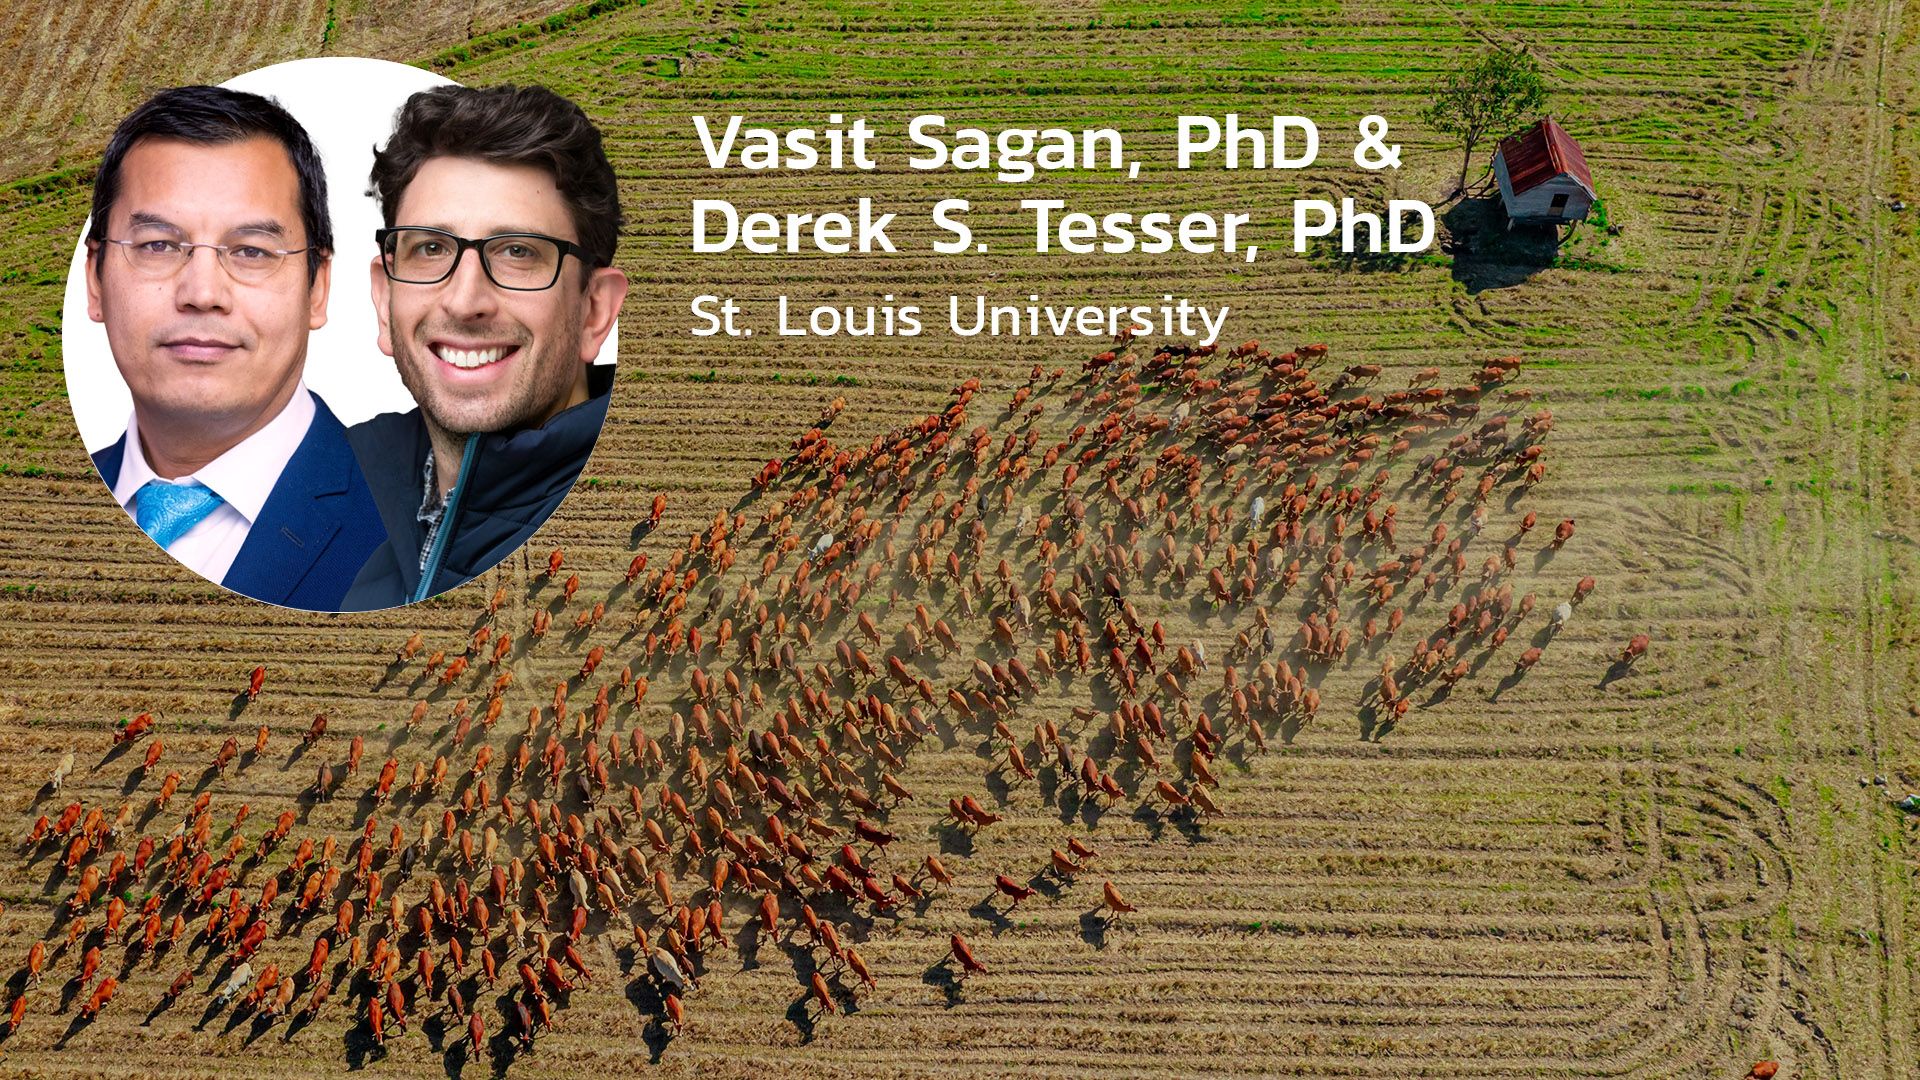
In this Climate TRACE series, we interview individual coalition members, contributors, and collaborators about their work. We recently talked with Vasit Sagan, PhD, Professor of Geospatial Science and Computer Science, Associate Vice President for Geospatial Science, and Derek S. Tesser, PhD, Senior Research Scientist, both at Saint Louis University's Remote Sensing Lab, whose research is powering Climate TRACE's cattle emissions data.
Which emissions sector do you focus on with Climate TRACE?
Vasit Sagan: We lead the coalition's work on pastures and support the TRACE-wide effort to map cattle operations globally. This includes mapping cattle operations, manure management, and facility-level methane and nitrous oxide emissions across pasture areas that support cattle, and also across large-scale feedlot operations.
Our goal is to help fill a critical gap in visibility. While we have global emissions data sets from the UN and other sources, in many parts of the world, there is little to no data about cattle and pasture-related emissions.
Why is it important to gain visibility into these emissions in particular?
Derek Tesser: Agriculture as a whole is a top-five contributor to global greenhouse gas emissions, with the livestock emissions we track an important subset of this. But at the same time, animal agriculture represents one of the sectors with the greatest potential for emissions reductions and carbon sequestration.
Unlike fully human-engineered sectors like power plants and transportation, animal agriculture is a coupled human-nature system. Emissions are driven not only by management decisions, but also by biological and ecological processes, including soil carbon dynamics, enteric fermentation (the digestive process in cattle and other ruminant animals where gut microbes break down plant materials, producing methane as a byproduct), manure decomposition, and landscape-scale biogeochemical fluxes.
Emissions from livestock systems specifically are very heterogeneous across space and time, and come with high uncertainty due to variability in feeds, animal physiology, management, soil processes, and climate. That creates both challenges and compelling opportunities for understanding and reducing emissions.
What makes it so hard to gather and validate cattle emissions data at a global scale?
VS: Counting cattle and estimating where they are across the world's pasture lands using satellite imagery is complicated. Cattle don't stay in one place and don't always fall in one or few pixels in satellite imagery; they move across pastures, climate zones, mountains, and wet and dry regions. Capturing that dynamic is quite difficult. Seasonality adds another layer. Pasture growth, biomass, and feeding ecology change within a year and across years, and cattle on pasture move based on those changes.
Then there are cultural aspects. In India, for example, cattle are raised for religious purposes rather than in regions focused on meat or dairy production. In South Korea and Pakistan, production systems and practices look completely different. Capturing these differences and linking them to the broader supply chain is a tough task, and hard to get right at a global scale.
Another challenge is computational. Mapping globally means processing massive amounts of satellite datasets and running computer vision algorithms and GeoAI foundation models to search for cattle operations and determine pasture use, and then count cows in the world's vast grasslands while detecting manure management systems. Scaling this with confidence and high accuracy is extremely demanding.
How are you combining technology and modeling to map cattle emissions?
DT: We use a combination of complementary data streams and analytic approaches to map livestock production systems across regions --- integrating high-resolution remote sensing, knowledge graphs, and foundation AI models into a unified GeoAI framework developed in collaboration with partners including Earth Genome.
Using these tools, we've been able to detect and map concentrated animal feeding operations, identify associated manure lagoons, and delineate pasture systems --- generating facility-level methane and nitrous oxide emissions data at a scale and resolution that simply didn't exist before.
And because we're mapping manure lagoons explicitly, the same data that quantifies emissions can point directly to intervention opportunities --- covering those lagoons to capture methane for energy is a practical, circular solution that benefits producers and communities alike.
VS: Building on that, what this allows us to do in practice is move from imagery to emissions-relevant activity data. The physics-based layer helps us interpret land surface characteristics and infrastructure, while the knowledge graph connects those observations to how systems actually function across different components of cattle operations from dairy farms, cattle on pasture, and supply chains from feeding ingredients, dairy products, meat production to transportation networks.
For pasture systems, that means integrating seasonal biomass, rainfall patterns, and feeding ecology to better estimate where cattle are during different times of the year --- linking livestock activity more directly to emissions without relying solely on static inventory assumptions.
For cattle emissions, what percentage comes from concentrated operations vs. pasture systems? What are their relative emissions intensities per unit of activity or per head of cattle?
DT: Globally, emissions from cattle in pasture systems and concentrated operations are actually quite comparable. Our current estimates suggest that about 55% of cattle-related methane emissions come from pasture-based systems, while around 45% come from concentrated operations such as large feedlots (CAFOs).
The slightly higher share from pasture systems largely reflects where cattle are located globally --- there are simply more animals raised on pasture than in large confined feedlots. In our accounting, pasture systems contribute roughly 5.1 billion tons CO₂-equivalent (20-year GWP) annually, primarily from enteric fermentation and manure left on pasture. Large feedlot operations contribute about 4.1 billion tons CO₂-equivalent, from enteric emissions and manure management.
It's also important to note that our current "concentrated operations" category focuses on large CAFOs --- generally facilities with more than ~1,000 head of cattle. If emissions from all confined or semi-confined cattle systems globally were included, the split would likely move closer to a 50/50 distribution.
Finally, the spatial characteristics differ significantly. Pasture emissions are widely distributed across large landscapes, whereas CAFO emissions are much more concentrated in small areas, which can make them easier to detect and target for mitigation even if their total global share is slightly lower.
How are you prioritizing regions, and what does that process look like in practice?
VS: To date, we've worked through many of the top cattle-producing countries --- including the US, China, India, Pakistan, Brazil, Argentina, and Bangladesh, as well as several major cattle-producing countries in Europe --- to build high-quality datasets with rigorous quality control and updated pasture maps. The goal is global coverage, but we're prioritizing high-emission regions first, as well as areas with particularly challenging cultural and environmental contexts. Effective mapping across Africa, for instance, is critical given rapid population growth, food security pressures, and ongoing land cover change --- but it's also where data gaps are most acute.
DT: Some regions have sparse data or unusual production systems, and that's where the techniques we're developing become critical --- filling in the gaps where data is limited or overlooked. Using high-resolution remote sensing, geospatial models, and AI, we can maintain global coverage while preserving regional accuracy.
Take our recent work in Brazil, for example. We mapped large feedlots --- which are very high emitters --- but it's often in these overlooked or data-sparse regions that you see the most dynamic changes in landscape and land cover. By linking newly detected facilities with historical deforestation and fire datasets, we found clear geographic alignment between livestock expansion and recent land cover change.
From a climate perspective, this represents a compounded emissions effect: first, the removal of tropical forest reduces a major carbon sink; and second, the addition of cattle introduces methane emissions from enteric fermentation and manure management. Understanding that compounded burden --- and where it's happening --- is exactly why it's so important to consider both global and regional levels in our analyses.
What kinds of "aha" moments have you encountered in this work?
DT: There were really two "aha" moments for me. The first was realizing just how powerful the Earth Index approach can be when applied at national scale. Once you train a local model with sufficient examples, it can scan an entire country and flag thousands of potential cattle feedlot locations --- essentially identifying the types of facilities we've seeded the system to look for. We then manually quality-check those locations to confirm them.
The key realization there was that many of these locations effectively represent new data. For example, Brazil --- the second-largest cattle population in the world outside of India --- has over 230 million head of cattle, yet there is no comprehensive global dataset that maps where those animals exist at the farm or facility level. Most reporting is only available at national or regional scales. But emissions are driven by activity at the facility level, so knowing where these operations actually are is critical.
That gap exists across much of the world. Even in the United States, detailed facility-level datasets are only publicly available for a handful of states. So one "aha" moment was realizing that the Climate TRACE pipeline was consistently identifying hundreds to thousands of specific livestock operations in every country we analyzed, effectively generating new transparency where that data simply didn't exist before.
The second "aha" moment came when we overlaid three datasets: 20 years of Amazon deforestation, recent wildfire activity, and the locations of newly identified cattle operations. The geographic alignment was striking. As scientists we're often cautious --- patterns in the real world are rarely that clean --- but the spatial relationship was hard to ignore.
At the same time, it's important not to oversimplify the story and say the forest was cleared directly for cattle feedlots. In many tropical regions, land-use change follows a longer economic progression. For example, forests are initially cleared for timber or other economic reasons.
How might various organizations use these data --- and what do you hope they'll do with them?
DT: These global datasets have wide-reaching applications, serving stakeholders across the entire value chain --- from producers and supply chain actors to financial institutions, governments, and policymakers. They enable concrete interventions, like capturing methane from manure lagoons for energy, or optimizing rotational grazing strategies that, as research with Native American communities in North America has shown, can actually regenerate grasslands and support soil carbon storage.
Ultimately the goal is multi-dimensional: environmental integrity, economic viability for producers, and equity across regions and communities.
VS: Yes, exactly, and at the end of the day what ties all of that together is transparency. These are global datasets about our food supply and the emissions connected to it --- built from satellite imagery, GeoAI, and physics, not assumptions.
When you can see the full picture clearly, you can act on it: reduce emissions, improve energy security, and strengthen food systems with nature-based solutions. That's what this work is really for. And the truth --- what we often refer to as data in science --- sets you free.
Interviewed by Logan Varsano and Daisy Simmons. This interview has been edited for length and clarity.